It has been a while.
The last few months have been busy, and I have not published as much as I would have liked. Now that I have a bit more time, I wanted to come back with a topic I keep finding interesting in backend design: knowing when not to add more infrastructure.
This post is about a small but useful architectural decision: building a resilient snapshot ingestion pipeline without introducing Kafka or a message broker from day one.
Not because Kafka would be wrong.
Because sometimes Postgres is enough.
The source code for the project is available here: github.com/egobb/plan-service .
When Postgres Is Enough: Building a Resilient Snapshot Ingestion Pipeline Without Kafka
Some ingestion problems look like they need a message broker at first glance.
There is an external provider. The provider exposes a snapshot. The payload can be large. Fetching can fail. Parsing can fail. Processing can partially complete. Meanwhile, the API still needs to answer search requests with predictable latency.
It is very tempting to reach immediately for Kafka, RabbitMQ or SQS. Those tools are often the right answer, but they are not automatically the right answer.
In this project, I wanted to explore a smaller design: a backend service that ingests provider snapshots, stages them in Postgres, processes them asynchronously, and exposes a stable search API — without adding a broker from day one.
The main idea is simple:
Not every ingestion pipeline needs Kafka immediately. For snapshot-based workloads, Postgres can be enough if it is used carefully as a staging and coordination mechanism.
The important part is the “carefully”.
Postgres is not a universal queue. It will not replace Kafka for high-volume event streaming, fan-out, replay-heavy architectures or long-term event retention. But for a modest snapshot ingestion pipeline, it can provide enough durability, visibility and concurrency control with fewer moving parts.
That was the trade-off I wanted to make here.
For reference, the most relevant parts of the repository while reading this post are:
README.md, for the project overview and local execution model.schema.sql, for theplans,ingestion_runsandstaging_planstables.StagingPlanPostgresRepository, for the DB-backed queue and row claiming.PostgresAdvisoryLockService, for per-provider fetch coordination.ProviderAdapterandProviderXmlStreamParser, for snapshot fetching and streaming XML parsing.PlanPostgresAdapter, for the canonical upsert and search query.SearchBulkheadExecutor, for local concurrency protection around/search.
The problem: external snapshots are unreliable boundaries
The interesting part was not fetching the data.
Fetching an XML document over HTTP is straightforward. The real question is where the unreliable boundary should end.
An external snapshot has several failure modes:
- the provider can be slow;
- the provider can return transient errors;
- the payload can be large;
- the XML can contain invalid records;
- processing can fail halfway through;
- a worker can crash after claiming work;
- the provider may stop returning a plan that the API still needs to expose historically.
The API should not inherit all of that instability.
I did not want /search to call the provider directly. That would couple user-facing latency to provider latency and make the read path dependent on a system I do not control.
Instead, the API reads from Postgres only. The ingestion pipeline is responsible for keeping that database up to date.
That decision led to the next problem: how to separate fetching, staging and processing without making the architecture unnecessarily heavy.
Why I split fetching from processing
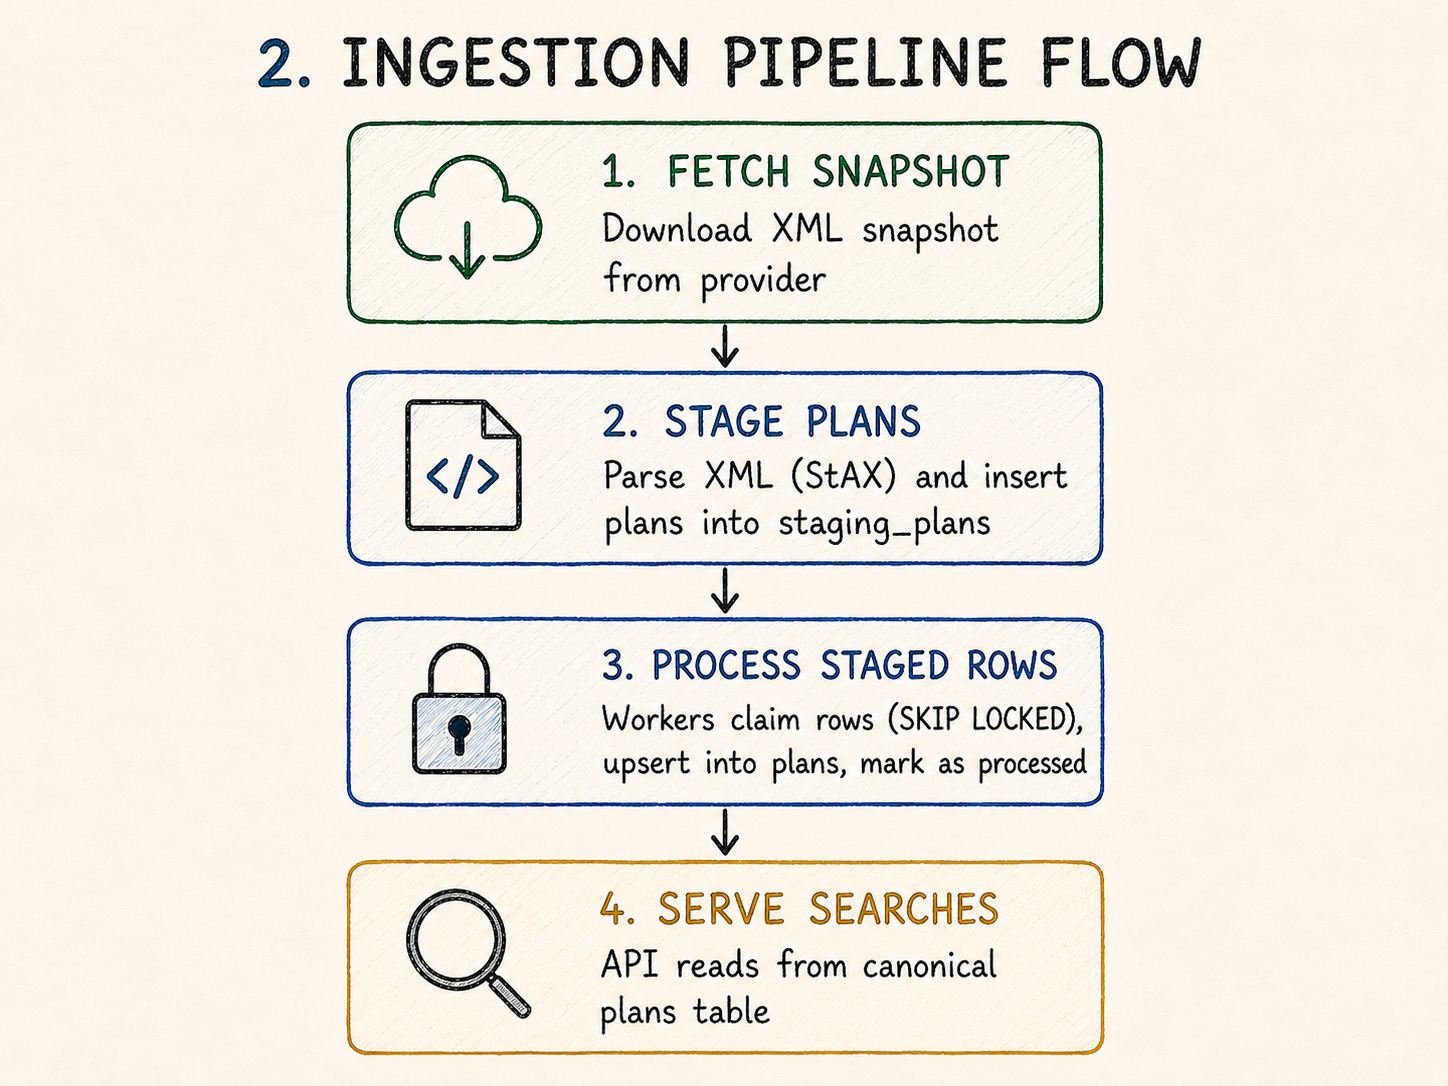
The ingestion flow is split into four stages:
- fetch the provider snapshot;
- stage parsed plans into Postgres;
- process staged rows asynchronously;
- serve searches from the canonical read model.
The fetch worker is responsible for network I/O and XML parsing. The process worker is responsible for converting staged data into canonical plans. The API only reads from plans.
That separation matters because each stage has different failure modes.
If fetching and processing were a single synchronous operation, a failure halfway through the snapshot would be harder to reason about. Did we parse everything? Did we write some rows? Can we retry safely? Are partial writes visible?
By staging first, the service creates a clear checkpoint. A snapshot run is recorded in ingestion_runs, and parsed rows are inserted into staging_plans. The process worker only consumes rows from runs that reached the STAGED state. That avoids consuming a partial snapshot if the fetch worker fails mid-stream.
In the code, that boundary is visible in the staging repository: workers only claim rows whose parent ingestion run is fully staged.
SELECT sp.id
FROM staging_plans sp
JOIN ingestion_runs ir ON ir.id = sp.run_id
WHERE sp.status = 'PENDING'
  AND sp.attempts < ?
  AND ir.status = 'STAGED'
ORDER BY sp.created_at ASC
FOR UPDATE OF sp SKIP LOCKED
LIMIT ?That check is small, but important. It means the process worker does not need to guess whether a snapshot is complete. The database records that state explicitly.
This is one of the parts I like most about the design. The database does not just store business data; it also stores operational state.
Architecture overview
At runtime, the service can run in three modes using the same application image:
apiworker-fetchworker-process
The API exposes GET /search. It does not fetch provider data. It queries Postgres.
The fetch worker periodically downloads the provider XML snapshot, parses it with a streaming parser, and stages rows in batches.
The process worker claims staged rows, transforms them into canonical upserts, and writes them to the plans table.
Postgres is the shared coordination point.
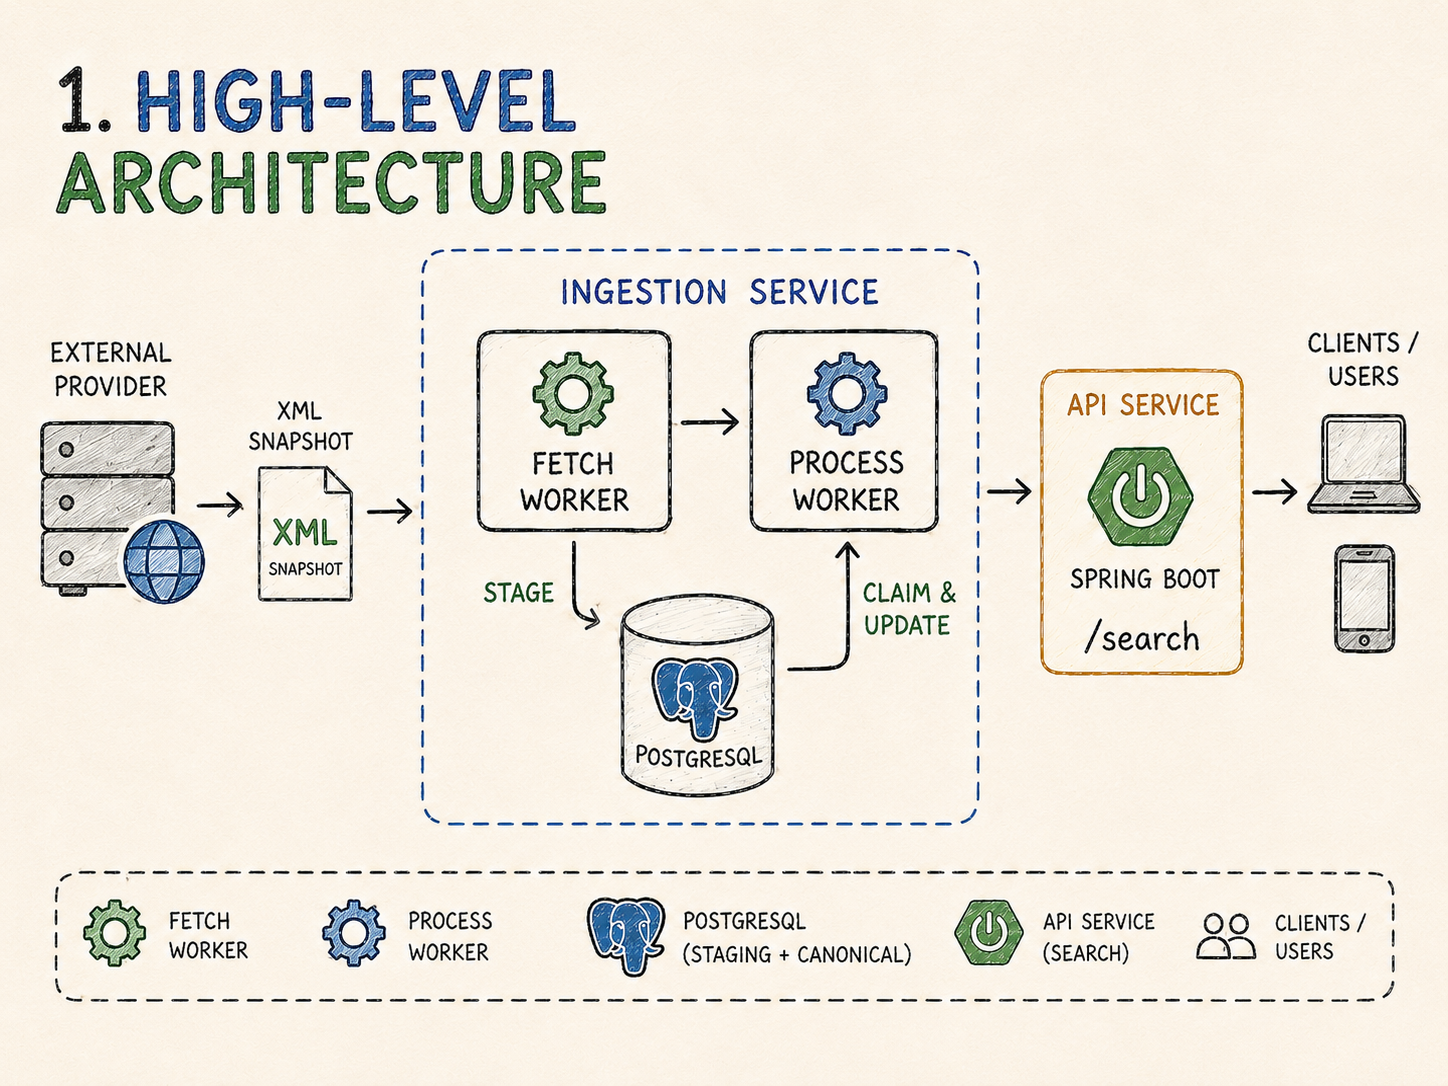
The flow is intentionally modest.
There is no broker. No Redis. No Kubernetes-specific mechanism. No extra distributed coordination service.
The design relies on Postgres for durability, row-level locking, idempotent writes and operational visibility.
That is not free, but it is understandable.
The local setup in the repository also follows the same separation. docker-compose starts the API, the fetch worker, the process worker, Postgres and a small demo provider. The point is not to simulate a complete production platform, but to make the operational shape of the service visible with a single command.
Using Postgres as a lightweight queue
The core design decision is to use Postgres as a DB-backed staging queue.
When the fetch worker parses the snapshot, it inserts records into staging_plans. Each staged row has:
- a
run_id; - a
provider_id; - provider plan data;
- a status such as
PENDING,PROCESSING,DONEorFAILED; - an
attemptscounter; - timestamps such as
created_at,claimed_atandprocessed_at; - a
last_error.
The table shape is deliberately operational:
CREATE TABLE IF NOT EXISTS staging_plans (
  id UUID PRIMARY KEY,
  run_id UUID NOT NULL REFERENCES ingestion_runs(id) ON DELETE CASCADE,
  provider_id TEXT NOT NULL,
  external_plan_id TEXT NOT NULL,
  title TEXT NOT NULL,
  sell_mode TEXT NULL,
  starts_at TIMESTAMPTZ NOT NULL,
  ends_at TIMESTAMPTZ NULL,
  created_at TIMESTAMPTZ NOT NULL,
  status TEXT NOT NULL,
  attempts INT NOT NULL DEFAULT 0,
  claimed_at TIMESTAMPTZ NULL,
  processed_at TIMESTAMPTZ NULL,
  last_error TEXT NULL
);This gives the service a durable backlog.
If a process worker crashes, the staged rows are still there. If a row fails, the error is visible. If processing falls behind, the backlog can be inspected with SQL.
That is the advantage of using the database as a queue in this kind of workload: the operational model remains visible.
Kafka would have worked, but it would also have moved complexity somewhere else. I would have gained a dedicated log, consumer groups and higher throughput potential, but I would also need to operate another component, model replay behavior, and explain why a snapshot input needs event-stream infrastructure.
Here, the provider input is not a continuous event stream. It is a periodically fetched snapshot. For that shape of problem, Postgres is a reasonable first coordination mechanism.
The trade-off is clear: the database now carries both serving and ingestion pressure. That means indexes, connection pools, batch sizes and worker counts matter.
This is the kind of trade-off I like: simple enough to operate, but explicit about its limits.
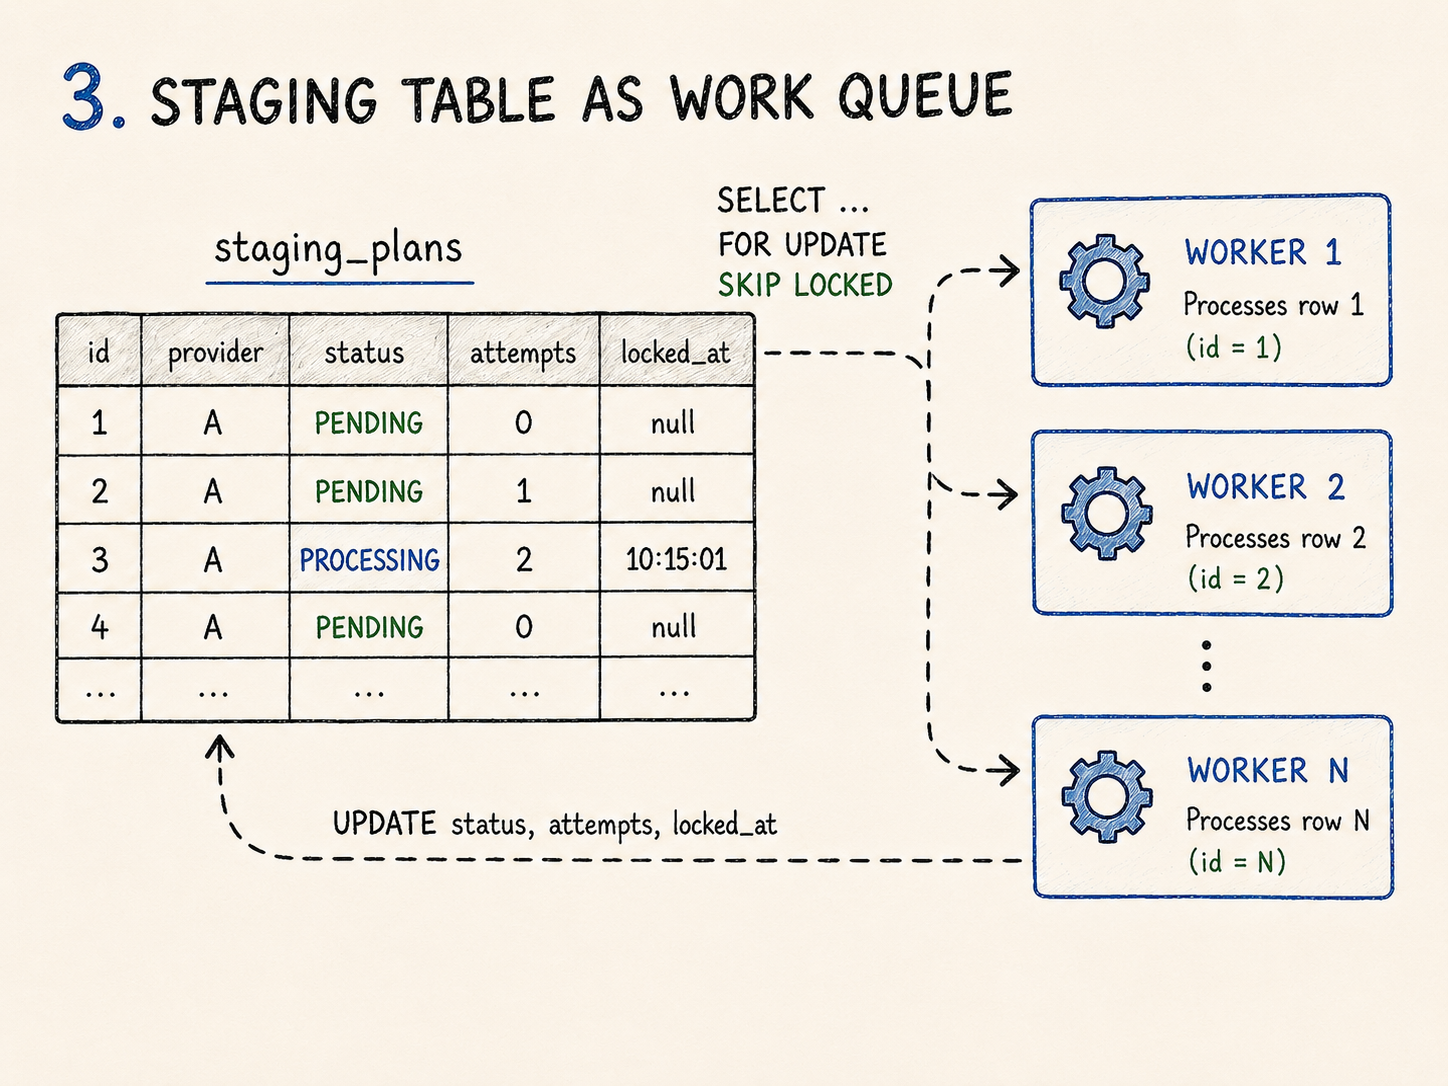
Scaling processing workers safely
Once the data was staged, the question became how to let multiple workers process data safely without building a broker.
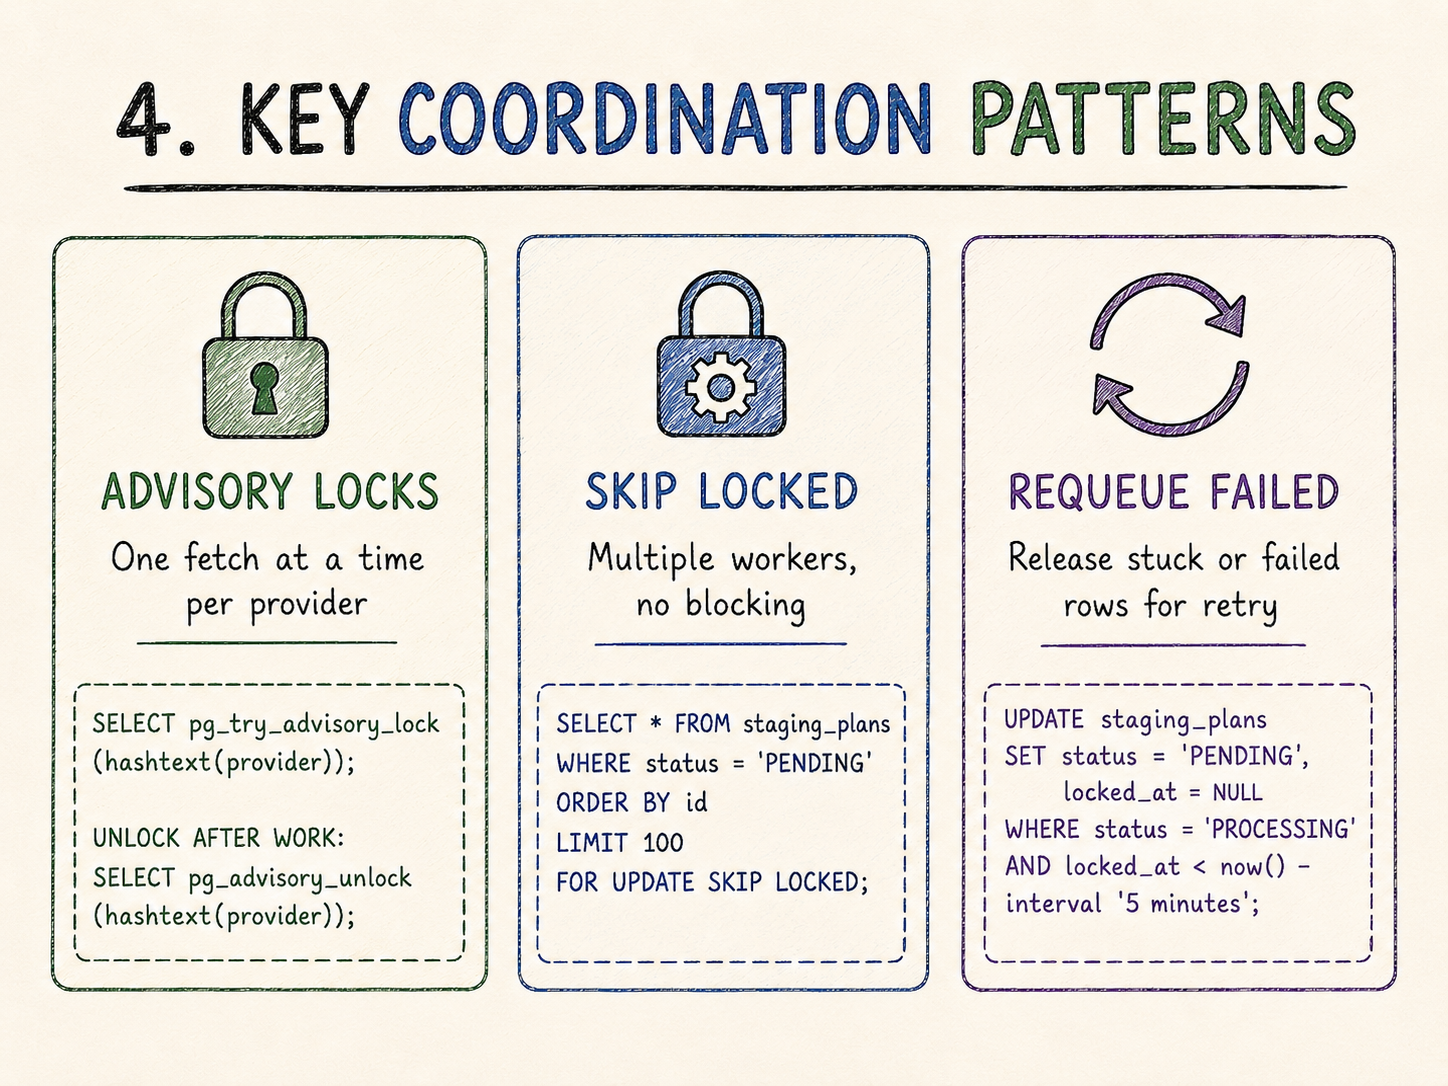
The process worker claims rows using SELECT ... FOR UPDATE SKIP LOCKED.
That pattern is useful because multiple workers can ask Postgres for pending rows at the same time. Rows already locked by one transaction are skipped by the others, so each worker claims a different batch.
The repository does this in two steps inside a transaction:
- select eligible staged row IDs with
FOR UPDATE OF sp SKIP LOCKED; - update those rows to
PROCESSINGand setclaimed_at.
A simplified version of the row-claiming logic looks like this:
SELECT sp.id
FROM staging_plans sp
JOIN ingestion_runs ir ON ir.id = sp.run_id
WHERE sp.status = 'PENDING'
  AND sp.attempts < ?
  AND ir.status = 'STAGED'
ORDER BY sp.created_at ASC
FOR UPDATE OF sp SKIP LOCKED
LIMIT ?;Then the claimed IDs are moved to PROCESSING:
UPDATE staging_plans
SET claimed_at = ?, status = 'PROCESSING'
WHERE id IN (...);There is also an important gating condition: staged rows are only claimable when their ingestion run has status STAGED.
That prevents a process worker from consuming rows from a snapshot run that is still being fetched or that failed before completion.
The process worker itself does not use a distributed lock. That is intentional. Horizontal scaling is achieved through row claiming.
The design is useful, but it is not magic.
SKIP LOCKED helps distribute work safely, but the database is still the bottleneck. At larger ingestion volumes, I would revisit this boundary first: either optimize batch processing further, add better queue indexes, or introduce a dedicated broker if the workload stops looking like a snapshot pipeline.
The repository also includes a requeue mechanism for rows stuck in PROCESSING. That matters for the boring failure mode where a worker claims a batch and dies before marking it as done.
UPDATE staging_plans
SET status = 'PENDING', claimed_at = NULL
WHERE status = 'PROCESSING'
  AND claimed_at IS NOT NULL
AND claimed_at < ?;Again, this is not exotic. It is a small operational repair loop that makes the queue recoverable.
Preventing concurrent fetches
Processing can be parallel.
Fetching is different.
For a given provider, overlapping fetches are usually wasteful and potentially confusing. Two workers fetching the same snapshot at the same time can duplicate staging work, increase provider pressure, and make operational signals harder to read.
The service uses a Postgres advisory lock around the fetch job.
The lock name is derived from the provider ID. Before fetching, the scheduled worker attempts to acquire the lock using pg_try_advisory_lock. If another instance already holds it, the run is skipped.
try (PreparedStatement ps =
         conn.prepareStatement("SELECT pg_try_advisory_lock(?)")) {
    ps.setLong(1, key);
    try (ResultSet rs = ps.executeQuery()) {
        rs.next();
        boolean acquired = rs.getBoolean(1);
        if (!acquired) {
            conn.close();
            return Optional.empty();
        }
        return Optional.of(new LockHandle(conn, key, lockName));
    }
}I like this boundary because it keeps the coordination local to the infrastructure already in use. No Redis lock. No extra scheduler. No separate leader election mechanism.
There is a cost: advisory locks are Postgres-specific and the lock holds a database connection for the duration of the critical section. That is acceptable here because fetch worker pools are intentionally small and the critical section is explicit.
The difference between fetch and processing is important:
- fetching is serialized per provider;
- processing is parallelized through row-level claiming.
That keeps provider pressure controlled while still allowing processing throughput to scale.
Parsing snapshots efficiently
The provider payload is XML, and the parser uses StAX.
That choice matters because a snapshot can become large. A DOM-style parser would load the whole document into memory. A streaming parser reads the document incrementally and emits plans as it encounters them.
The provider adapter streams directly from the HTTP response body into the XML parser. Parsed plans are handed to the staging service through a callback. The staging service buffers them and inserts them in batches.
try (InputStream is = response.getBody()) {
    if (is == null) {
        throw new IllegalStateException("Provider returned an empty body.");
    }

    xmlStreamParser.parse(is, plan -> {
        plansCount.incrementAndGet();
        planConsumer.accept(plan);
    });
}This keeps memory usage more predictable:
- the HTTP body does not need to be materialized fully;
- the XML tree does not need to be loaded fully;
- staging batches are bounded by configuration.
The parser is also defensive. Invalid mandatory start dates cause the individual plan to be skipped while parsing continues. Invalid optional end dates are treated as null. Fully invalid XML fails the snapshot attempt.
That distinction is useful. Bad data inside one plan should not necessarily poison the entire snapshot, but malformed XML probably should.
There is also XML parser hardening: DTD and external entities are disabled to reduce exposure to XXE-style issues.
factory.setProperty(XMLInputFactory.SUPPORT_DTD, false);
factory.setProperty(XMLInputFactory.IS_SUPPORTING_EXTERNAL_ENTITIES, false);The exact implementation is slightly defensive because StAX implementations differ in how they expose supported properties, but the intention is clear: stream the snapshot and avoid unnecessary XML parser risk.
Preserving historical facts
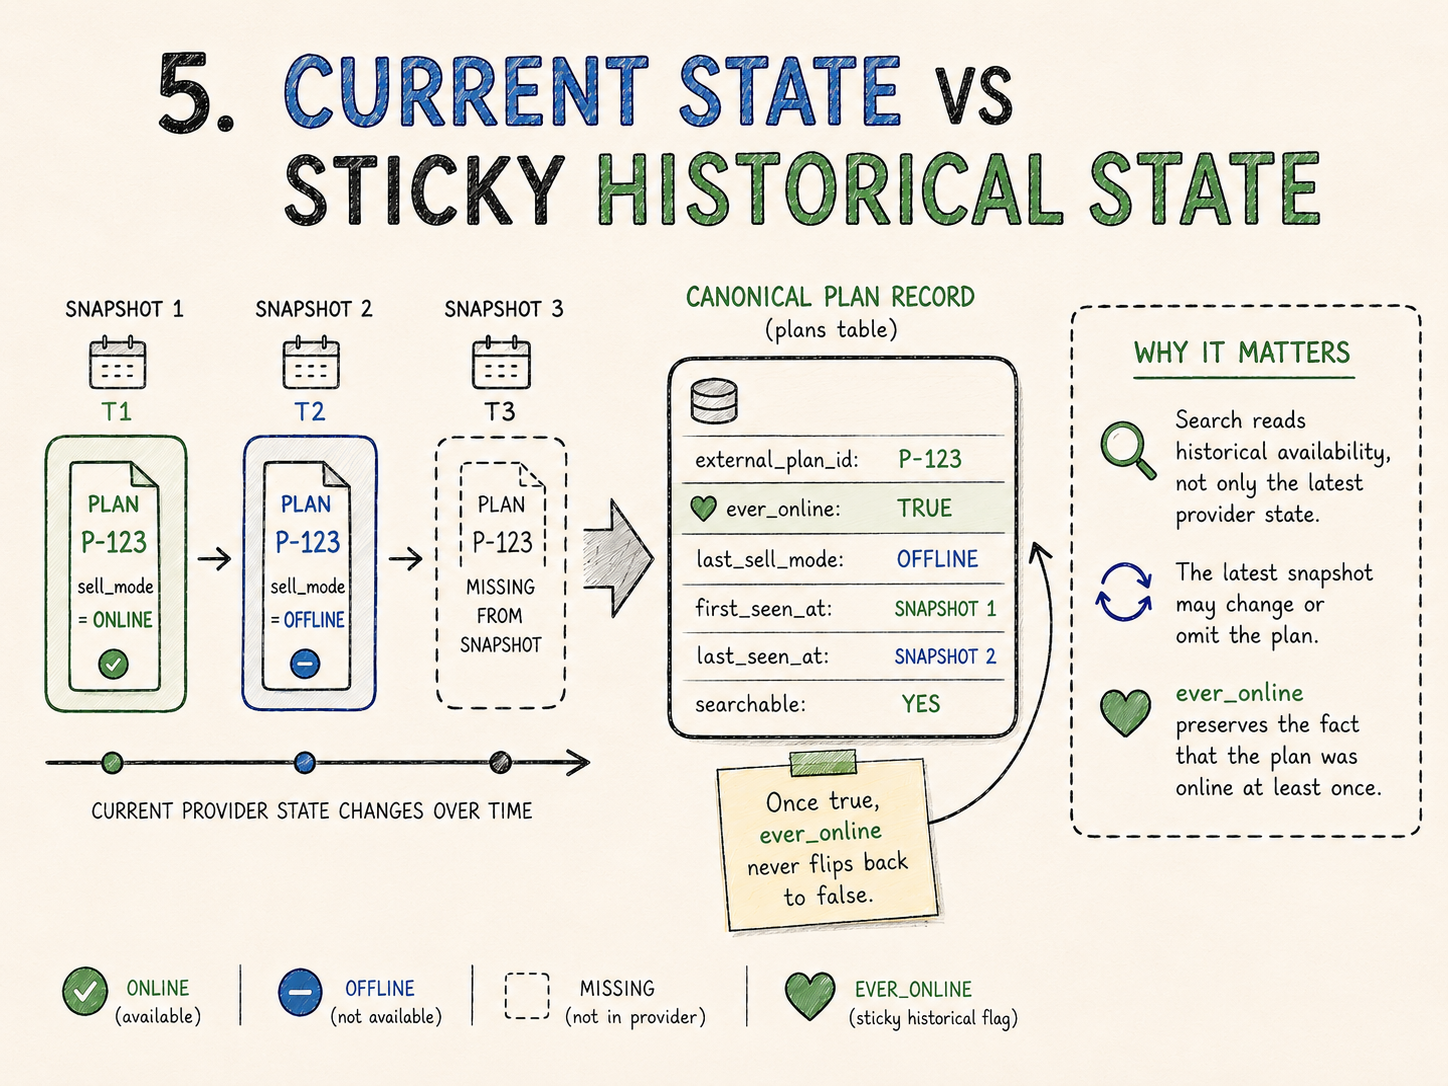
The provider returns the current snapshot. The API, however, needs to return plans that were ever available online.
Those are different concepts.
The current provider state can change from one snapshot to the next. A plan can be online, then offline, then disappear from the snapshot entirely. If the service simply mirrored the latest snapshot, historical search would lose information.
The canonical table therefore stores ever_online.
When a staged plan has sell_mode = ONLINE, the canonical row is upserted with ever_online = true. Once that flag becomes true, it never flips back to false.
That is a monotonic update.
The most important part of the upsert is this:
ON CONFLICT (provider_id, external_plan_id) DO UPDATE SET
  title = CASE
    WHEN EXCLUDED.last_seen_at >= plans.last_seen_at
    THEN EXCLUDED.title
    ELSE plans.title
  END,
  ever_online = (plans.ever_online OR EXCLUDED.ever_online),
  last_sell_mode = CASE
    WHEN EXCLUDED.last_seen_at >= plans.last_seen_at
    THEN EXCLUDED.last_sell_mode
    ELSE plans.last_sell_mode
  END,
last_seen_at = GREATEST(plans.last_seen_at, EXCLUDED.last_seen_at);The service also tracks last_sell_mode, first_seen_at and last_seen_at. The upsert protects against older processed data regressing newer values by comparing timestamps, while ever_online remains sticky.
This is not full temporal history. The service does not store every immutable snapshot version. It preserves the historical fact needed by the search contract: this plan was online at least once.
That is enough for the current search semantics, and much cheaper than storing a complete event history.
The trade-off I accepted is that ever_online cannot represent every business nuance. It cannot say “this plan was online but later revoked as a terminal state.” If that became necessary, I would move toward an explicit history table or event log.
Protecting the Search API
The read path is intentionally boring.
GET /search parses date parameters, applies pagination bounds, delegates to a query handler, and reads from the plans table. The SQL filters by ever_online = true, optionally applies start/end bounds, orders by starts_at, and paginates.
SELECT id, title, starts_at, ends_at, min_price, max_price
FROM plans
WHERE ever_online = TRUE
ORDER BY starts_at NULLS LAST, id
LIMIT :limit OFFSET :offset;The important design choice is that /search never calls the provider.
That keeps read latency dependent on the database, not on an external HTTP call.
The service also adds a local Resilience4j bulkhead around /search. The bulkhead limits in-flight search requests and fails fast with 503 when the limit is reached.
try {
    return Bulkhead.decorateSupplier(this.bulkhead, supplier).get();
} catch (BulkheadFullException e) {
    metrics.recordSearchRejected("bulkhead_full");
    throw new SearchTooBusyException(
        "Too many concurrent /search requests. Try again shortly."
    );
}This is not a global rate limiter. In a larger deployment, that responsibility would usually live at the edge: API gateway, ingress or load balancer.
Here, the bulkhead is a local guardrail. It protects the DB connection pool from being exhausted by uncontrolled concurrent reads.
There is also a short-lived Caffeine cache for hot search ranges. It is intentionally conservative: only first-page queries with small limits are cached, and empty results are not cached.
Again, the design is modest. The point is not to hide database problems forever. The point is to make saturation explicit and controlled.
Observability and operational thinking
The repository includes basic but useful operational hooks.
Spring Boot Actuator exposes health, metrics and Prometheus endpoints. Custom Micrometer metrics track provider fetches, staging inserts, processing outcomes, requeued rows, scheduler skips and search rejections.
Logs can be emitted in plain text or JSON. The logging setup includes MDC fields such as request ID, run ID, provider ID and app mode. There is also a low-noise access log filter for /search, with configurable slow-request logging.
The operational model has two separate surfaces:
- the public API;
- the ingestion pipeline.
For the API, I would watch search latency, 5xx rate, bulkhead rejections and DB connection pool pressure.
For ingestion, I would watch provider fetch failures, staging throughput, processing throughput, retry activity and backlog growth.
This separation is important. The provider can be down while the API remains healthy, because the API serves from Postgres. That does not mean the service is fully healthy; freshness is degraded. But it does mean the failure mode is easier to explain.
The part I like about this approach is that most operational questions can be answered directly:
- Are we fetching snapshots?
- Are rows being staged?
- Are workers processing them?
- Are rows stuck in
PROCESSING? - Is
/searchprotecting itself under load?
That is a good property for a small service.
The repository has a dedicated observability document as well: docs/observability.md
. I would treat that as part of the design, not as after-the-fact documentation.
Testing strategy
The test suite covers the main risk areas rather than only testing happy-path controllers.
There are unit tests for:
- domain invariants;
- query handling and caching boundaries;
- staging orchestration;
- processing orchestration;
- scheduled worker behavior;
- provider adapter retry behavior;
- XML streaming parser behavior;
- controller parameter parsing and bulkhead delegation.
There are also integration tests using real Postgres through Testcontainers. Those are the tests that matter most for this design, because much of the correctness depends on SQL semantics.
The integration coverage includes:
- upsert and search round trips;
- sticky
ever_onlinebehavior; /searchcontroller wiring;- validation error responses;
- timezone handling for date-time inputs;
- staging-to-processing flow;
- preventing processing from runs that are not fully staged;
- claim gating based on ingestion run status.
The most relevant files are under app/src/test
, especially:
PlanPostgresAdapterITStagingProcessingITStagingClaimGatingByRunStatusITSearchControllerITProviderXmlStreamParserTest
That said, I would still add more concurrency-focused tests.
The code uses FOR UPDATE SKIP LOCKED, but an explicit test with multiple concurrent workers claiming from the same backlog would make that guarantee more visible. I would also add an EXPLAIN-based regression test or at least documented query plans for larger datasets.
What this design gives you
This architecture gives a useful set of properties for a snapshot-based ingestion service:
- Decoupled reads:
/searchis independent from provider availability. - Retryable processing: staged rows can be retried with bounded attempts.
- Crash recovery: rows stuck in
PROCESSINGcan be requeued after a TTL. - Worker scalability: processing can scale horizontally through
SKIP LOCKED. - Controlled fetch concurrency: advisory locks avoid overlapping fetches per provider.
- Operational visibility: ingestion runs and staged rows are inspectable in Postgres.
- Simple infrastructure: no broker is needed for the initial workload.
- Historical search semantics:
ever_onlinepreserves the fact that a plan was once online.
The design works because the workload is snapshot-oriented and the reliability requirements can be met with database coordination.
That is the key constraint.
What it does not solve
Postgres queues are not a universal replacement for Kafka.
This design would become less attractive if the service needed:
- very high ingestion throughput;
- multiple independent consumers over the same stream;
- long-term event replay;
- complex fan-out;
- strict event ordering across partitions;
- immutable audit history for every snapshot version;
- cross-service event distribution.
There are also current implementation limits worth being honest about.
The provider fetch path has retry/backoff logic, but not a wired circuit breaker. A real circuit breaker could be useful if provider failures became frequent and expensive.
Failed staged rows end in FAILED, but there is no separate dead-letter table with a dedicated replay workflow.
Rows are claimed in batches, but upserts are currently applied item by item. That improves isolation and makes failures easier to reason about, but it is not the most efficient write strategy.
The schema includes run-level processed and failed counters, but the process worker does not update them yet.
The observability foundation is present, but dashboards and concrete alert rules are not part of the repository.
None of these are fatal for the project. They are the boundaries I would expect to revisit as the service grows.
What I would improve next
The first improvement I would make is to add a persistent dead-letter flow.
The current FAILED status is useful, but a dedicated dead-letter table or replay command would make operations clearer. Failed rows should be easy to inspect, classify and replay deliberately.
The second improvement would be richer ingestion metrics. I would add gauges for pending backlog size, age of the oldest pending row, number of failed rows and number of processing rows older than the configured TTL. Some of this can be derived with SQL today, but exposing it directly would make alerting easier.
The third improvement would be a real provider circuit breaker. Retry/backoff is already useful, but a circuit breaker would make repeated provider failures less noisy and more explicit.
I would also optimize processing once there is evidence that row-by-row upserts are a bottleneck. A true batch upsert per claimed batch would reduce database round trips, but I would only introduce it after measuring the current behavior.
The repository already includes a GitHub Actions workflow under .github/workflows/ci.yml
. I would extend it with a Docker Compose smoke test and maybe a small load test for /search, rather than only compiling and running tests.
Finally, I would improve the local demo setup with larger synthetic snapshots. A small static provider is enough for a quick start, but a portfolio project about ingestion benefits from showing how the backlog behaves under more realistic volume.
Final thoughts
The important decision here is not whether Postgres or Kafka is better.
That is the wrong framing.
The better question is: what is the simplest architecture that satisfies the current reliability, scalability and operational needs?
For this workload, the provider is snapshot-based. The API must be stable. Processing must be retryable. Workers should scale horizontally. Failure modes should be visible. Local development should stay simple.
Postgres is enough for that.
Not forever. Not for every system. Not as a universal queue.
But enough for this boundary, at this stage, with the trade-offs made explicit.
That is usually where I prefer to start: with the smallest design that makes failure visible, keeps operations understandable, and leaves a clear path for the next architectural step when the workload actually earns it.
Repository
Source code: github.com/egobb/plan-service